


A law enforcement outfit’s effectiveness hinges a great deal on the quality of its analysis — how quickly and accurately it can pinpoint crime hotspots, uncover incidents with a similar modus operandi, radius map criminal activity, identify areas of high repeat offenses, track the journey to crime, et al.
Even with the best of tech tools such analysis isn’t easy.
For the Peel Regional Police, crime analysis posed an even greater challenge, because of the sheer size and diversity of the areas it serves.
Peel’s goal to build “a safer community” extends to more than 1.2 million residents of the cities of Mississauga and Brampton.
READ RELATED STORIES
GIS rollout an electrifying experience at Guelph Hydro
RONA maps a pathway to success
GIS system has saved money an improved City of Winnipeg services
The force accomplishes its mandate through its five police divisions, eight community stations, and 2,658 employees – 1,899 officers and 759 civilians.
Despite its vast jurisdiction, Peel has implemented a highly effective and time-tested crime analysis system — harnessing GIS technology from Toronto-based ESRI Canada Limited.
Mapping crime trends
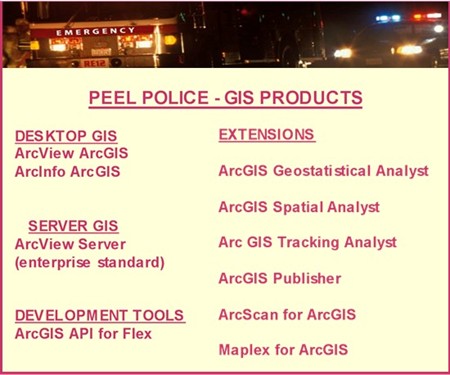
Specifically, Peel uses intelligence provided by ESRI’s ArcView and ArcInfo GIS software offerings to analyze criminal activity, according to Raphael Djabatey, who heads the crime analysis unit at Peel Police.
These applications, said Djabatey, help officers do their jobs far better through features such as:
- Electronic pin-maps of patrol zones that visually depict some special characteristics of areas they police
- Updated information on crime locations and places of interest
- Spatial data and geographically-referenced hyperlink information, which could include photos, graffiti and much more
- The ability to create and edit spatial data, such as patrol zones and street networks
Smart extensions
Over the years, the force has added a broad range of “extensions” to ArcGIS desktop to improve and expand the functionality of its crime tracking.
For instance, the Spatial Analyst extension enables crime analysis using a “spatial clustering” technique.
Essentially, this helps the force identify crimes within Peel’s jurisdiction with the same characteristics – that may turn out to have been committed by the same person or group.
With 238,476 “incidents” reported across Peel (2009 numbers), this ability to zero-in on similar crimes can help big time in nabbing the perpetrators.
The ArcGIS Tracking Analyst extension also helps with crime control and prevention, though in different way.
It lets officers visualize crime shifts in neighbourhoods over time and create a visible path depicting crimes, as well as activities of persons of interest.
For instance, when analyzing vehicle theft data it identifies areas where the volume of such thefts has been high, as well as recovery locations.
It also helps with tracking suspicious cell phone activity that may have some bearing on the crime.
Intelligence obtained from Tracking Analyst can be used to create videos for court presentations, Djabatey said.
Another hugely helpful tool, he said, is the Geostatistical Analyst extension that lets one see the links between crimes and other socio-economic factors. Based on this one can predict probable trends and patterns of criminal activities.
Peel soon saw the value of extending GIS access and functionality from analysts to officers in the field.
GIS to go
However, it recognized that the average officer in their cruiser would likely not have a great deal of GIS expertise.
Peel wanted to let these officers – who may not be GIS savvy – access and use mapping technology, Djabatey said.
This, he said, would help them better handle the tactical issues they confront in areas they patrol.
The solution Peel eventually implemented was a “mashup” that combined data or functionality from several sources within a single integrated GIS application accessible as a Web service.
This rich Internet application was created on top of Peel’s ArcGIS server software, taking advantage of the ArcGIS API (application programming interface).
Peel used Adobe Flex to create a Web ‘crime map’ that officers could use, even those with minimal GIS technology skills, Djabatey said.
The mashup, he said, blends Web services from ESRI with data from Peel police, including information on patrol zones, crime locations, issues and persons of interest et al.
The user interface supports interactive analysis of regional crime data and statistics using a Web browser (Internet Explorer).
“This analysis is near real-time and within 24 hours we push it out to officers in their police cruisers, or wherever else they have Internet access.”
Over time, Peel has added new features and functionality to the “mashup.” These include the ability to search, identify hotspots, and do crime comparisons.
Crime statistics for the current year are presented and compared with the previous year, said Djabatey.
This helps us with trending and forecasting.
He said intelligence from “crime comparison” is applied to a variety of categories, including breaking and entering, auto theft, robberies, homicides, and sex assaults.
