


Media and publishing professionals know that infographics are hugely popular, and are more likely to be shared via social media than a standard blog post or article.
By combining images with data, infographics get much more mileage than text or graphics alone. You can use them for news, presentations, or press releases on your company blog or Web site to attract publicity and show off your expertise.
Companies without a graphic designer on board or on budget couldn’t easily take advantage of infographics in the past.
DIY infographics startups capturing attention
However, thanks to online chart and map creation tools, any business can now turn an interesting concept into an engaging infographic. Here’s how to get started, along with tools that can step you through the process.
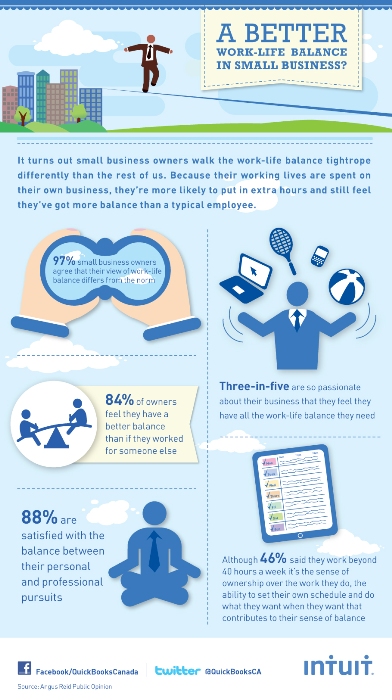
Infographic from Intuit
Choose your graphics and data wisely
Every business holds expertise in something, and that specialized knowledge can make for an interesting piece. The information in an infographic is just as important as clean, uncluttered visual quality, if not more so, so pick an engaging topic. This can be a survey your company has commissioned, helpful factoids about your industry, or data culled from the sources we list below. Mix up various graphic elements and categories of information rather than relying on a single source.
ITBusiness stories with inforgraphics
– Infographic: Who wins the most Canadian government ICT funding?
– Top Canadian Internet memes of 2011 [Infographic]
– Infographic: How does Toronto stack up as an ICT hub?
…
You’ll want to plan out your infographic much like you would plan out a Web site, using wireframes or another method to map out exactly what it’s going to look like and how the information will be presented. Make sure your company name and Web site are featured prominently within the infographic and can’t be easily cropped out.
Data from Google
Looking for ideas about the types of data you want to detail in an infographic? Google’s useful Public Data tool lets you create chart visualizations with information from sources such as the U.S. Census. The catch: your data can’t be exported, so you’ll either need to use a screenshot of Google’s chart for your infographic, or just grab the statistics and plug them into your own graphic. Another data source, Google Insights, offers up statistics on web searches, which you can also use as an element of an infographic.
Templates and icons
If you aren’t a graphic designer by trade, use templates and icons to build your infographic. This Infographic Toolbox from Google contains a number of editable pie charts, maps, and symbols that you can use. Icon Archive contains a huge range of free icons, and more that you can pay for.
You’ll have to pay for well-done infographic templates, but it won’t break the budget. Graphic River has a number of templates for around $6. That gets you the PSD files for use in Photoshop. Templates require you to enter the info by hand, but they look way better than one you can design yourself if you’re not a designer. If you don’t have a background in Photoshop, then skip to the next section for suggestions on how to hire someone to make your infographic for you.
Free infographic builders
Free services contain the tools you need to piece together an infographic of your own. You’ll need some skills in Photoshop or similar graphic design software, such as the free GIMP, to put together your own piece.
StatSilk
Statsilk offers a number of tools for creating interactive charts and maps, including its free StatTrends software. Many Eyes This web-based tool lets you plug in your own data to create custom data visualizations. Free data sets are available here, making it a great resource.
Creately
Creately lets you create simple graphics and flowcharts online for free. Paying users can export their work, and plans start at $5 a month.
Visual.ly
Visual.ly offers an infographic-building tool, if you’re only looking to use data from Facebook and Twitter.
When free isn’t a good idea
If you’re too busy or design-challenged to create your own infographic, invest in one. A small to medium-sized graphic design shop, creative agency, or an individual graphic designer are all good spots to start. You can find a quality designer atFreelance Switch or post your gig at Authentic Jobs.
A good infographic will run you any number of hours of a designer’s time, so budget according to their hourly rates after getting an estimate for how long your concept will take to execute.
Licence with Creative Commons
Make the copyright information clear on your infographic so that Web site owners and media outlets can see at a glance if they are legally allowed to use your infographic. The best way to do this is to create a Creative Commons licence for your infographic using this form. Since the idea behind an infographic is to get publicity, not allowing republication isn’t a wise move.
It is smart in your Creative Commons licence not to allow modification of your work. This will give you recourse if you need to ask any third-party site to take down your infographic that it has altered unfavourably. Post a link to your Creative Commons licence prominently underneath your infographic on your Web site, and wherever else you choose to publish your infographic.
Publicize your infographic
Your infographic is more likely to be popular if you advertise that it’s there. Even if you didn’t use Visual.ly to create your infographic, you can upload your infographic to its database for others to see. Flickr is also a great resource for putting your infographic in front of people like bloggers who are searching for cool visuals. You’ll want to push it out to all the conventional social media channels such as Facebook, Twitter, LinkedIn, and StumbleUpon.
Many companies with an eye to getting their infographic picked up by the media will promote it in a press release. A 2011 study by PR Newswire showed that press releases that incorporate any form of multimedia, including videos, are much more likely to be viewed than a text-only release. PR Newswire also gives some great tips for concocting a media-friendly infographic.
Avoid the infographic pitfalls
There are many critics of the infographic medium, but Web site page view statistics don’t lie. Infographics are far more visually interesting than a standard blog post, no matter how many are out there. Infographics get a bad reputation when businesses cheap out on graphic design or provide poor quality information.
Beware of including information that comes from only one source, since this can unfairly drive the facts towards a particular conclusion that may have been funded by whoever commissioned the survey. In the social sciences, this is called single-source bias, and many infographic makers are guilty of this. Look at your infographic the same way that you would a research paper or a university essay. The more sources you have, and the more building blocks you have to tell an interesting story, and the more credible that story is.
If you keep the information useful and the graphics engaging, you’ll create an infographic that will attract attention to your business online. Don’t just build an infographic because they are popular; build one that you would enjoy looking at during your busy work day.
